Before building a playoff simulator or a matchup predictor, it helps to ask a simpler question: what does a normal flag football score look like? The answer from the 2025 Alabama data is not a smooth bell curve. It is a sport with lots of zeroes, large margins, and scores that cluster around touchdown-plus-conversion patterns.
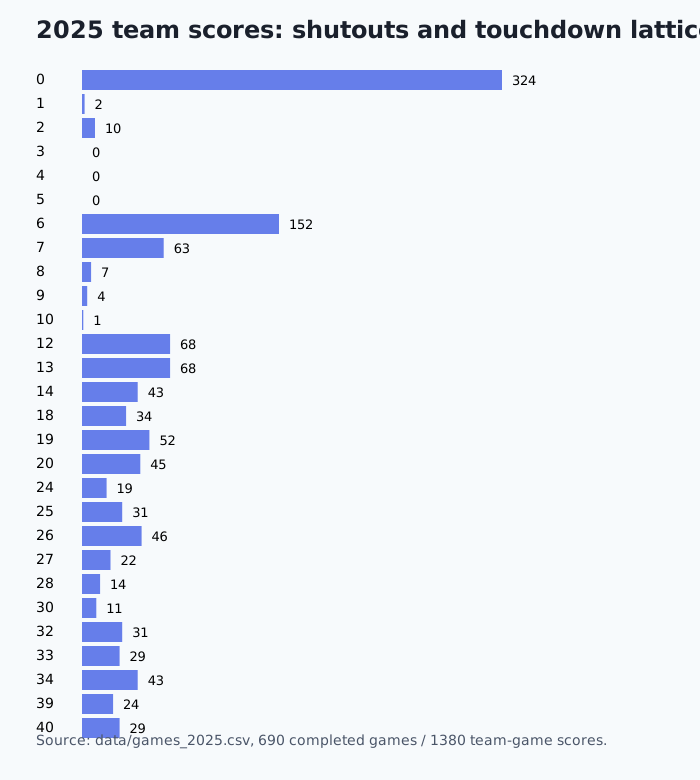
Shutouts were not rare
The data file contains 690 completed games, which means 1380 team-game scores. A team finished on zero in 324 team-games, and 323 of 690 games (46.8%) had at least one side shut out. That changes how you should read both averages and blowout margins.
Margins are wide
The median margin was 20 points; 371 games (53.8%) finished by 20 or more. A simulator that treats most teams as tightly clustered will understate how often a favorite can build a multi-score gap.
Scores live on a touchdown lattice
Exact multiples of six accounted for 633 team scores (45.9%). The next two most common remainders were one and two, which is what you expect when touchdown scoring and conversion attempts dominate the grid. That is why 6, 12, 13, 19, 26, 34, and 40 show up as local spikes.
Data and methods
All numbers were recomputed from data/games_2025.csv. The companion machine-readable summary is score-distribution-2025.json. The file uses completed games with both scores present; playoff games are included because the question is scoreboard shape, not regular-season rating calibration.
Modeling implication
A normal score model is a poor first assumption for this sport. A better practical model needs to handle shutouts, touchdown/conversion increments, and heavy right-tail margins separately.